Introduction to D-Tale Library for Visualization
D-Tale is python library to visualize pandas data structure. D-Tale is interactive graphical user interface tool based on the Flask and React based tool. D-Tale is the one of the easiest ways of visualizing and analyzing pandas data structure.
Installation of D-tale library:
Pip install dtale
#conda environment
Conda install dtale
Importing dtale library. Using seaborn library to load dataset. Here, I am using Iris dataset.


dtale.show(df) will show data frame in d-Tale window.

Top left corner arrow pops up the menu as shown in figure. This menu has multiple features like summary of dataset, find out outliers and find out duplicates.

This figure shows the dataset description with feature ‘sepal_length’. Left hand side is list of features and right side is histogram of feature value.

Correlation: Heatmap is used to show the correlation matrix of the dataset.

Duplicate: To find duplicate instances in dataset.

Single Feature Analysis: Click on feature name as shown in figure and perform operation on single feature.

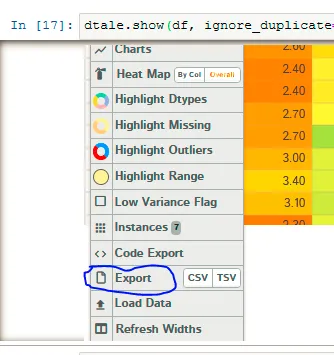
Export the modified dataset: Export the modified dataset either in CSV or TSV format.

To conclude, we have seen how D-tale library can be used in graphical interactive way to do EDA analysis of pandas data frame.


This is the kind of quality content I love to see.